 Hidden
Hidden
Hidden
Hidden
Hidden
Hidden
Hidden
INSTRUNET WORLD TUTORIAL instruNet World software tutorial sections include:
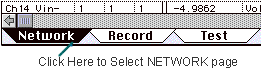
This is a step-by-step tutorial that shows the user how to navigate within the world of instruNet. Controlling instruNet hardware can be done manually though the free instruNet World application program, or through the programming languages Visual Basic and C. This document deals exclusively with the easy-to-use application program instruNet World application program. instruNet World software allows you to set up and probe your network, record waveforms, save them to disk, load them from disk, and view them post acquisition. This document focuses on the buttons at the top of the instruNet World pages, yet these functions can also be accessed in the menubar. For documentation on the menubar and on instruNet World PLUS "iW+" (a version of instruNet World with more features), please click here. Record Waveforms in 7 Easy Steps This section explains how to record waveforms in several easy steps. 1. Install your hardware and software 2. Run the instruNet World application program. 3. Select the Network Page.
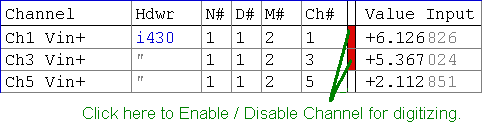
4. Enable a Channel for digitizing. Please enable several voltage input channels for digitizing. An example of this is illustrated below where "Ch1 Vin" and "Ch3 Vin" are enabled for digitizing on the i430. Voltage input channels are typically labeled ChX Vin+ or ChX Vin-. These work identically when doing single-ended voltage measurement (i.e. read a voltage between an input terminal and ground), and are used as a pair when doing differential voltage measurement (i.e. reading a voltage between 2 input pins). If instruNet voltage input hardware is not installed, you will not be able to digitize. Also, note that the contents of the Network page may vary depending on what is installed on your computer.
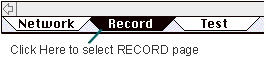
5. Attach a signal source. 6. Select the Record Page.
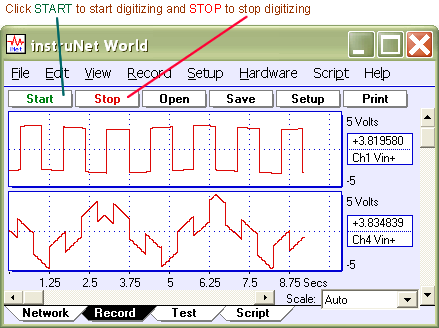
7. Tell instruNet to start digitizing.
8. Tell instruNet to stop digitizing 9. Save your waveforms to disk 10. Record again 11.
Load your saved waves from disk
How to Quickly Connect a Specific Sensor Click here to learn how to connect a specific sensor to specific software. 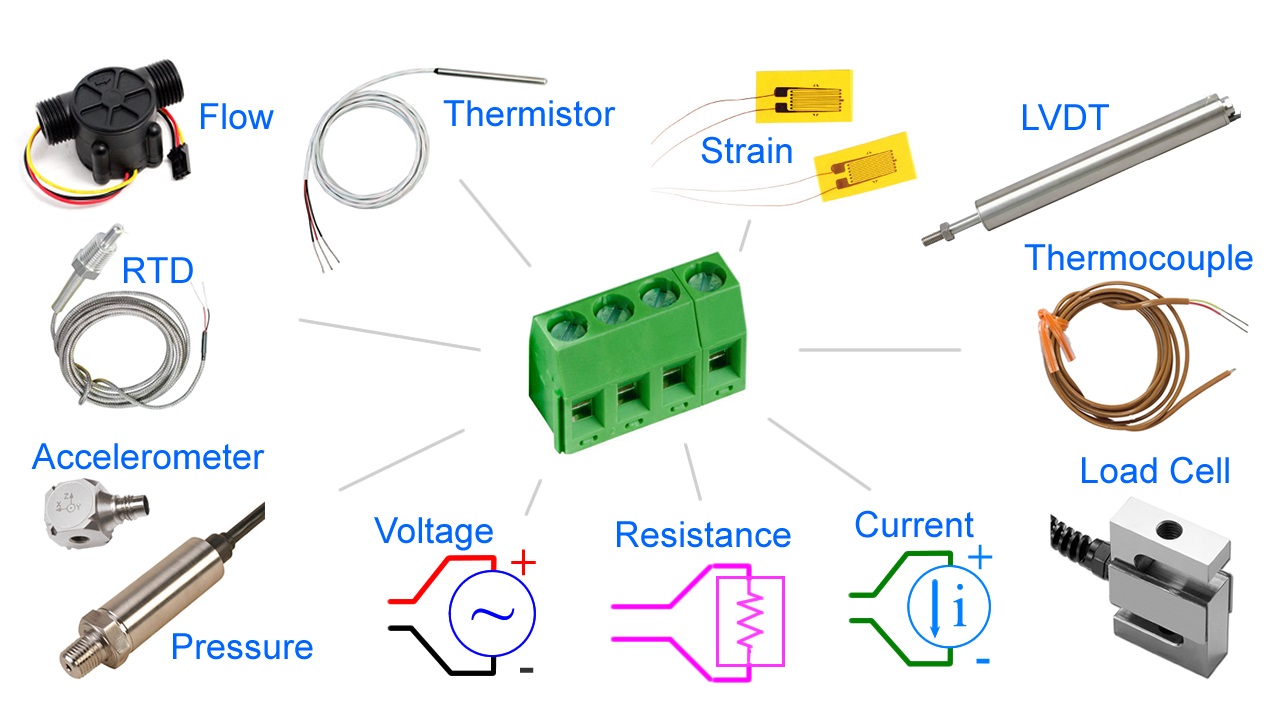
If you want to learn how to digitize in instruNet World, and then save a text file to be loaded by a spreadsheet program, post-acquisition, please click here. If you want to digitize into a spreadsheet, while data is being acquired in realtime, please consider the Direct To Excel program, described in detail here. Note that Direct To Excel requires that an iW+ license be installed on your computer. • In order to run Direct To Excel, all of the following must be installed on your computer. If this is not the case, please proceed to the next section.
If you are not sure these requirements have been satisfied, try running the Direct To Excel program, as described below, and if it runs ok, then you are probably ok. • Exit instruNet World and select under the Windows START menu: Programs / instruNet / Application Software / Direct To Excel / Direct To Excel.exe. This will run a program (shown below) written in Visual Basic; the source code of which is currently installed on your hard disk. You are welcome to modify it.
• Press the Channels button, select 2 channels for digitizing (i.e. click in small rectangle after channel address, it will turn red), and close the instruNet Network window. •
• To learn more, please press the Help button or click here. • Close the Direct To Excel program by clicking in the upper right corner. • We will now run a Windows program called "VB Instrument" that implements a strip chart/oscilloscope recorder for 1 to 16 channels. It is similar to instruNet World, yet is written in Visual Basic and the source code is installed on your computer. You are welcome to modify it. • Exit any currently running instruNet software and select under the Windows START menu: Programs / instruNet / Application Software / VB Applications / VB Instrument.exe. • Press the Channels button, select 4 channels for digitizing (i.e. click in small rectangle after channel address, it will turn red), and close the instruNet Network window. • Press the Start button and watch the data appear in the window, as shown below.
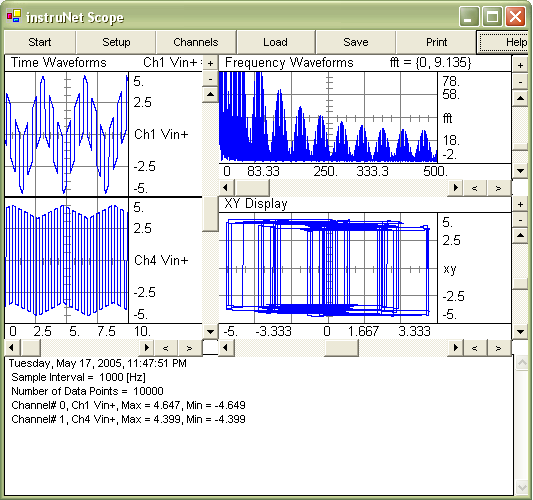
• To learn more, please press the Help button or click here. • Close the VB Instrument program by clicking in the upper right corner. • We will now run a similar Windows program (written in Visual Basic, source code included) called "VB Scope". It implements a 2 channel strip chart recorder / oscilloscope, XY Record, and Spectrum Analyzer. • Exit any currently running instruNet software and select under the Windows START menu: Programs / instruNet / Application Software / VB Applications / VB Scope.exe. • Press the Start button and watch the data appear in the window, as shown below. Ch1 and Ch2 timewaves are shown in the left-most display, the frequency spectrum of Ch1 is shown in the upper-right display, and an XY plot of Ch1 and Ch4 are shown in the lower-right display.,
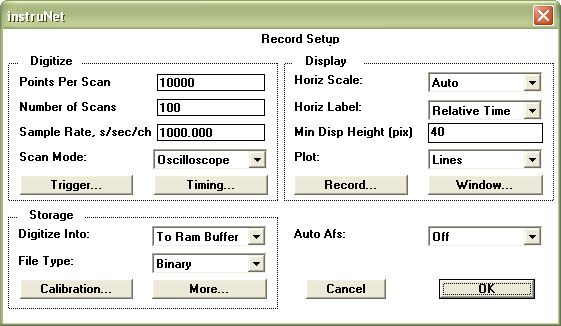
• To learn more, please press the Help button or click here. • Close the VB Scope program by clicking in the upper right corner. Digitizing Analog Signals into the Computer The Setup button at the top of the Record page opens a dialog box that effects the manner in which waves are recorded. • Click the Setup button to open the Record Setup dialog, as illustrated in Figure 2.1.
This dialog is used to set the base sample rate, the number of points to be acquired per Scan, the number of Scans to be acquired and the recording mode (i.e. oscilloscope or strip chart recorder). All instruNet Networks are set up with one base sample rate (i.e. number of points digitized per second) and individual channels can have sample rates less than or equal to the base sample rate. This allows, in effect, each channel to have its own sample rate. The Sample Rate field sets the base sample rate in units of samples-per-second-per-channel. The Points per Scan field determines the amount of data to be collected in each Scan. The Number of Scans sets the number of Scans to be acquired. The Scan Mode popup has three choices: Strip Chart, Oscilloscope, and Oscillo Queued. Strip Chart is selected for continuous strip chart recorder mode and Oscilloscope or Oscillo Queued are selected for oscilloscope mode. Refer to Oscilloscope or Strip Chart for a full description of these modes. The Auto Afs popup requires iNet32.dll version ≥ 3.3.4.4 and enables digital processing that reduces aliasing. This is often used with i500 analog low pass filter daughterboards. For details, click here. If the instruNet system reduces your sample rate to an unacceptable level, or your analog voltage data is too noisy, please see SAMPLE RATE VS. INTEGRATION VS. NOISE. instruNet Networks are self-configuring and on startup determine the maximum rate at which data can be transferred. This rate is displayed after pressing the Timing button, in the Network BPS field, in units of bits per second. 4 million bits per seconds is the fastest, and 100Kbps is the slowest. This rate slows down with networks that have many Devices and long network cables (i.e. >100ft). • Select Oscilloscope in the Scan Mode popup and set the Points per Scan field to 100. 100 points at 1000s/sec will take 0.1 seconds to acquire. Leave the rest of the Dialog in its default settings, and click OK to return to the Record Page. • Click the Start button to begin digitizing. Notice how 0.1 second long waveforms continuously appear on the screen, in a manner similar to an Oscilloscope. Before, we were in Strip Chart mode where these segments were continuous with respect to each other. We are now in Oscilloscope mode. To learn much more about digitizing, please refer to the Record Page Reference.
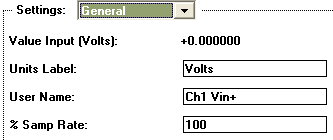
• Click the Stop button to stop digitizing, and then click on the top display's channel name label at the right edge of the display. The Display dialog will open. Choose General in the Settings popup. Enter the value 20 in the % sample rate field as shown above, and press OK. This will cause the top channel to be digitized at 20% of the master sample rate, or 200s/sec. The channel in the lower displays will continue to run at the master sample rate of 1000s/sec.
Notice how the wave in the top display contains fewer points, due to its reduced sample rate, as illustrated to the right. • Click the Setup button at the top of the Record page, and then click the Trigger button to open the Trigger dialog, as shown in Figure 2.2. Trigger Modes Three trigger types are allowed, as specified in the Trigger field: Off, Auto and Norm. If Off is selected, data acquisition begins as soon as the Start button is pressed in the Record Page. If Auto is selected, data acquisition begins after the trigger criteria is met, but if the trigger condition is not met within a second or so, the recording begins anyway. If Norm is selected, instruNet waits until the trigger condition is met, indefinitely of necessary. For more details on trigger, click here.
• Select Auto in the Trigger popup, type a reasonable threshold voltage into the Threshold EU field (e.g. 1V) and then select Rising or Falling in the Slope popup. Click OK to exit the Trigger Dialog, click OK to exit the Setup Dialog and then click the Start button to begin recording. The waveforms should appear on the screen, with the beginning of each Scan synchronized to the trigger event. If the signal applied to the trigger channel does not periodically cross the threshold voltage, Auto trigger will digitize anyway every second or so. • Press Stop when you are done acquiring. To learn more about Triggering, please refer to Trigger Reference. • Click the Setup button at the top of the Record page to open the Record Setup dialog, as shown in Figure 2.1. Display Options The Plot popup is used to set the drawing mode to plot Dots or Lines (i.e. light one pixel for each data point, or connect these data points with lines), and the Grid popup (accessed by pressing the Record button in Setup dialog) selects whether or not to overlay a grid on each display. Viewing Many Channels Another technique is to hide individual displays by setting the Display View field to Hide for each channel that you do not want a Display in the Record page. One does this by opening the channel options dialog for each channel you want to hide, select the Display setting, and then set the Display View field to Hide. If you want to view channels numerically, then please consider Panel Meters, which are only available in iW+ (described at instrunet.com/plus). Time Of Day or Relative Time Time Relative to start of digitization, left edge corresponds to 0 secs
Time of Day, e.g. first grid corresponds to May 18, 2005, 4:52pm + 59.5 seconds Working with Files and Data The File Type field determines the file format for the saved data, and is set to one of Binary, Binary Merge, Text, or Text Merge. For a detailed description of each format, please see File Types. If you want to save data to a spreadsheet program, post-acquisition, please click here. For details on maximum file and RAM buffer sizes, click here. • Select Lines in the Plot popup, select Off in the Grid popup, select "Strip Chart" in the Scan Mode popup and, set the Points per Scan field to 10000 to set the buffer size of an intermediate RAM buffer that holds data before it is sent to disk (10000 points at 1Ks/sec is a comfortable size). Set the Digitize Into popup to "To File", and select 0.5 secs/div in the Horiz Scale popup. Click OK to exit the dialog. Click Start to begin recording. When the File save dialog appears, type a folder name and select a location for the waveforms that are about to be "spooled" to disk. • After a minute or so, press the Stop button to stop digitizing. Scroll through your waveforms via the horizontal scrollbar. Notice that the computer goes to your hard disk periodically to automatically load in information from disk. • Try various options and settings to gain some familiarity with the wonder world of instruNet World. Some things to try are listed below:
Digitize directly into RAM memory or a File on Disk? instruNet stores field settings in a hierarchical data tree illustrated in figure 2.4
To access a piece of information, you must supply an address within this data tree. This address consists of 6 parameters, as described below:
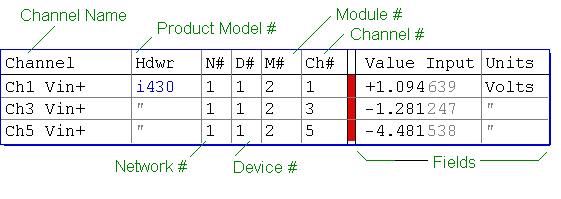
The instruNet World user navigates within this data tree via the Channel Setup dialog, described in the next discussion. instruNet World does not require the user to know about Setting numbers and Field numbers since all items are defined using popups and edit fields. The programmer, on the other hand, must supply 6 numbers to a subroutine to read and write to any field on the instruNet data tree. The Network page shows the current Field settings for each channel in a tabular (i.e. spreadsheet) format, and is also a useful tool for navigating around the instruNet data tree. The data tree maintains any changes you make until you Reset the network via the Reset button, reset the computer, or load in new setting from disk via the Restore or Open buttons at the top of the Network page. In many cases, a user will set the fields as needed, stored them to disk, and then reload them when instruNet world is first opened. • Exit all instruNet software and run instruNet World. • Select the Network page by pressing the Network tab at the bottom of the window. • Press the Reset button at the top of the window to reset all Fields in the Data Tree. Press OK when a dialog asks for confirmation. Figure 2.5 illustrates how information is organized in the Network page. The channels that are displayed on your computer will vary depending on what hardware is installed; therefore, don't worry if your screen is a little different from the Figures.
The Network Page The column labeled "Value Input" depicts the current real-time value (input or output) of the channel, in engineering units. All columns to the right of the Value Input column are Fields that specify the type of signal connected to the channel and how it is being read. The horizontal and vertical scroll bars are used to move around and make changes to the tables contents. To change a Field's setting, one can click on its cell and then change its value. For example, to change the name of channel Ch1 Vin1+, one would click on the "Ch1 Vin1+" cell. • Click on any cell in the Units Label column to open the Channel Setup dialog, as shown in figure 2.6.
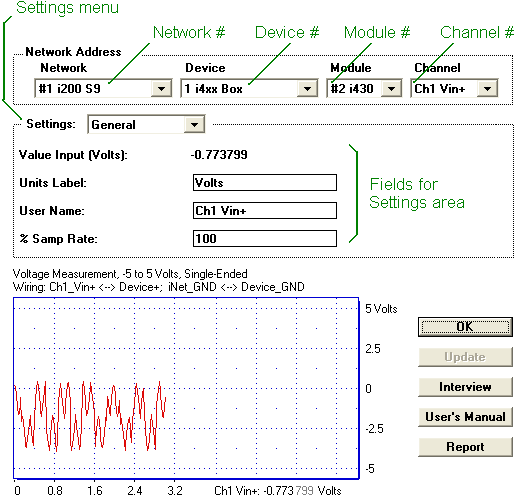
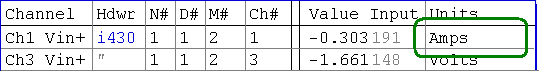
Using the Channel Setup dialog, any Field within the instruNet Data Tree can be viewed or modified. The upper-most 4 popup menus specify a channel address (i.e. Network, Device, Module, Channel), the Settings popup specifies a Setting group (e.g. General, Lowpass Filter, Highpass Filter, etc); and the Settings area shows between 1 to 8 Fields depending on the Settings group selected. For example, in Figure 2.6, we are viewing the General settings for channel Ch1 Vin+, which is physically connected to Module #2 (i430 card), 1st Device (i4xx Card Cage), 1st Controller (i2x0). The General settings group contains 4 Fields: Value Input, Units Label, User Name, and % Sample Rate. The Value Input field shows the real-time, current value, of the channel. Units Label is the displayed label for the channel's value (e.g. "Volts", "Amps", "C"). User Name is the user's name for the channel (e.g. "Temp 1", "Pressure 2", etc). % Sample Rate is the speed, as a fraction of the Master Sample Rate, that the channel is digitized (e.g. 50% would mean the channel is digitized at one-half the sample rate specified in the master Record Setup dialog). The small display at the bottom of the Channel Setup dialog shows a plot of the current real-time value of the Channel. • Click on the Units Label field and change "Volts" to "Amps". Click OK to exit the Channel Setup dialog. The clicked on cell should be update to "Amps", as shown in figure 2.7.
• Scroll through the Fields of the Network page using the horizontal scroll bar at the base of the window. Notice that the first 5 columns remain fixed, while the cells to the right of Column #7 shift left and right with the horizontal scrollbar. You can scroll through, and view, all Fields for all Channels in this manner. Figure 2.8 shows the Network Page for Ch1 Vin+ after scrolling a little to the right.
• Scroll horizontally to the left edge so that "Value Input" is in Column #8 and then scroll vertically until an input channels is no longer in the top row. For example, in Figure 2.9, a Voltage Output channel is in the top row. Notice that the title to Column #8 changed from Value Input to Value Output. This is because the titles are optimized for the one channel in the top row.
• Vertically scroll to the top of the table and then click on the net cell of the first row. (it should contain a 1) This will cause the Channel Setup dialog to open and to display the clicked on cell. Channel Addresses
• Explore your instruNet world via the 4 Channel Address popup menus at the top of the Channel Setup dialog, and the Settings popup menu. Press OK when you are done exploring. Saving & Loading Network Settings • Select the Network page by clicking the Network tab. The first two buttons at the top of the Network Page, Restore and Store, work as a pair. Clicking the Store button saves the current network settings to a preferences file within your operating system folder. Clicking Restore loads in this file. File open and save dialogs do not appear, since the Fields are always saved to the same file (i.e. a file with the same name). Obviously, you loose your last saved network when you press the Restore button (careful !). • Press the Store button to save your current Field settings to disk. • Press the Clear button to erase your Field settings to their default values. Notice how the "Amps" units label has now returned to its default setting of "Volts". • Press the Restore button to restore the previously saved settings. Notice how the "Amps" units label has returned. To save the settings to the file of your choosing, click the Save and Open buttons. • Press the Save button. Type a file name and select a file location when the File Save dialog appears. Remember where you put this file. • Now press the Clear button to clear all settings to their default values. • Press the Open button and select your saved file in the File Open dialog. Notice how the "Amps" units label now appears. At this time, you have 2 files on your hard disk with your saved network settings. The Reset button differs from the Clear button in that it resets the hardware in addition to clearing your fields. It has the same affect on an instruNet network as restarting the computer. For example, Reset will reset clock in the controller, whereas Clear will not.
• Select the Network page by clicking on the Network tab. • Click on the name of the voltage input channel with the attached signal source (e.g. "Ch1 Vin+"). The Channel Setup dialog will open with the address of the channel you clicked on displayed in the Network Address. Additionally, the real-time value of the channel, in Engineering Units (EU) will appear at the bottom of the display, as shown in Figure 2.11.
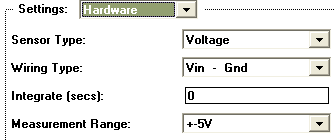
• Select Hardware in the Settings popup, as shown in Figure 2.12.
• Click on the Sensor popup to view the various Sensors that can directly be attached to this channel, as shown above. This popup tells instruNet which sensor is connected to your physical hardware terminals (instruNet has no way of seeing what is out there). For more detailed information on connecting sensors to instruNet, please refer to Connecting to Sensors.
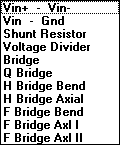
The Vin+ - Vin- option is used for differential Voltage measurements to measure the voltage between the Vin+ and Vin- terminals. The "common" signal on both terminals is ignored, and therefore this technique can be used to reduce noise. The Vin+ - Gnd option specifies Singled-Ended voltage measurement, which measures the voltage between the voltage input terminal and the Ground terminal. The latter 6 options (i.e. ¼ Bridge, ½ Bridge Bend, ½ Bridge Axial, Full Bridge Bend, Full Bridge Axial I and Full Bridge Axial II) are used to specify a wiring options when working with a Strain Gage sensor. These wiring options are described in more detail in Connecting to Sensors.
This Field specifies the voltage input range. Accuracy is increased as the range is reduced. For example, a ±80mV range might be accurate to ±50uV and a ±5V range might only be accurate to ±0.5mV. If you input a voltage in excess of a bound, the bound is read. For example. If you apply 3V to a voltage input with a ±1.25V range, then 1.25V will be read by the computer. For more details on setting the measurement range, click here.
Averaging your Signal with Integration If the instruNet system reduces your sample rate to an unacceptable level, or your analog voltage data is too noisy, please see SAMPLE RATE VS. INTEGRATION VS. NOISE. • Select Constants in the Settings popup, as illustrated in Figure 2.13. What you see depends heavily on the selected Sensor in the Hardware settings area. Below is an example of what one typically sees a thermistor sensor.
These Fields are used to specify constants that are used to calculate engineering units when working with Resistance, Current, RTD, Load Cell, Accelerometer, Potentiometer, and Strain Gage sensors. For example, Rshunt specifies the value of the shunt resistor, in ohms, when doing a Resistance measurement. Please refer to Connecting to Sensors for details on how to use these. • Click OK in the Channel Setup Dialog to return to the Network page. • Enable several voltage input channels for digitizing by clicking once on Column #7 of each channel, as illustrated in Figure 2.14.
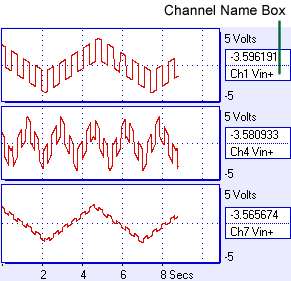
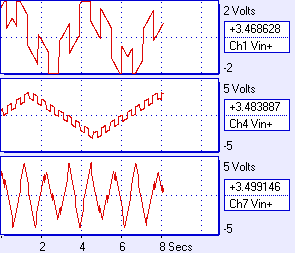
• Select the Record page by clicking on the Record tab at the bottom of the window. • Click the Start button to begin recording. The Record Page automatically creates a separate display for each recorded channel, as shown in Figure 2.15. The actual signal that appears will depend on the connected signal sources. • Click the Stop button to Stop recording.
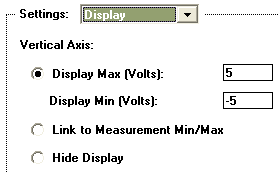
• Click on the ChannelName box of the top-most display to open the Channel Setup dialog at the Display settings area, as show in Figure 2.16.
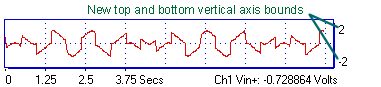
• Change the Display Max Field to 2, change the Display Min Field to -2, and click the lower-right Enter button. Changes take affect when either the Enter or Update button is pressed. The illustration below shows a display set up with a -2 to +2 vertical axis. The Link to Measurement Min/Max option automatically sets the vertical axis to the measurement range (e.g. 0 to 100°C if you set up a thermocouple sensor for 0 to 100°C measurement). For details, see display reference or measurement range.
• Press OK to exit the Channel Setup dialog, and then press Start to begin recording. Notice how the vertical axis scale change effects the appearance of the recorded signal, as shown in Figure 2.18.
Working With Calibration, Different Scales, and Mapping
Internal units are the native units used by the sensor. These are "Volts" for a Voltage sensor, "ohms" for a resistance, "Amps" for a current source, "C" for a temperature sensor, "Kg" for a Load Cell, "Strain" for a strain gage and "g" for an accelerometer.
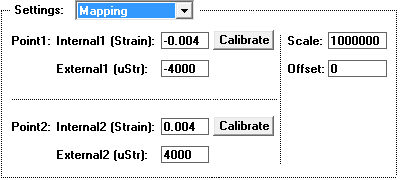
Imagine a linear temperature sensor that puts out 0.1 Volts when dipped in ice water (0°C) and 1.0 Volts when dipped in boiling water (100°C); and you want instruNet to display °C numbers in the Record page and the Network page. To do this, one would set the Mapping fields to:
And set the Units Label field in the General Settings area to "C". The Units Label does not effect instruNet numerically, yet is interpreted as random text that is simply placed next to numbers (i.e. it is a "label"). The Mapping fields; however, effect numbers, yet not labels. The Mapping numbers can also be used to implement calibration. Suppose a thermocouple (i.e. temperature sensor) is attached to instruNet and is already returning °C numbers (since that is the native units for the thermocouple), yet you find there is a +2.0°C offset error in your sensor (i.e. you measure 2.0 when sensor is at 0.0), and want instruNet to "correct" for this error. To do this, you would set the OFFSET parameter to -2.0 and the mapping from internal units to external units might then look something like this:
Notice that Mapping can be used to correct for an offset error by adding a constant and can correct for a gain error by multiplying by a scale value (i.e. y = [x*scale] + offset). For example, instead of setting the above 4 values, one could set the Offset field to 2.0, to show a 2°C Offset. If you change the Scale or Offset fields and then press Ok or Update; the internal1, external1, internal2, external2 fields update automatically to reflect the new line. If one presses the Calibrate button in the Mapping area, the system will measure the sensor in Native internal engineering units, and place this newly measured value into the Internal field next to the Calibrate button. For example, one could place a temperature sensor in 100.0°C water, set
External_2 to "100.0", press the Point#2 Calibrate button, and the system would load
Internal_2
with the measured value.
If you do not see the Mapping Calibrate button, make sure you are using instruNet software version ≥ 3.5.0.1.
Working with Analog Anti-Aliasing Filters
All voltage input channels support digital lowpass, highpass, bandpass and bandstop filters. The cut-off frequencies, minimum dB stopband attenuation (i.e. filter order), maximum dB passband attenuation, and filter type (e.g. elliptic, Chebyshev B, Chebyshev S, and Butterworth) can all be programmed separately for each channel via the Lowpass, Highpass, Bandpass and Bandstop Settings areas. In fact, these 4 models can be run at the same time (i.e. in serial) to simultaneously do lowpass, bandpass, bandstop and highpass filtering on the same channel. For example, one might only want to see frequencies between 20 and 1000Hz, except for the 55 to 65 band. This would involve a highpass filter at 20Hz, a bandstop filter between 55 and 65Hz, and a lowpass filter at 1000Hz. • Select the Network page by clicking on the Network tab and then press the Reset button to reset the network and all Fields. • Click the channel name cell of the channel that is attached to your signal source (e.g. Ch1 Vin+), and then select Lowpass in the Settings popup, as shown in Figure 2.19.
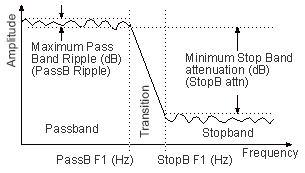
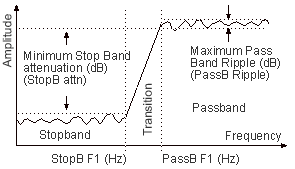
The lowpass filter is illustrated in Figure 2.20. Notice that 4 numbers are needed to describe the lowpass filter: minimum stop band attenuation (dB), maximum pass band ripple (dB), pass band cut-off frequency (Hz) and stop band cut-off frequency (Hz). • Turn the filter On by selecting Elliptic in the Filter popup (or any of the other options other than Off). • Enter a passband cut-off frequency value into the Passband F1 Hz field, a stopband cut-off frequency into the Stopband F1 Hz field, a minimum stop band attenuation into the Stopband Attn field, and a maximum pass band ripple into the Passband Ripple field. Acceptable values would be {100, 150, 80, 1}. Press the Enter key when done setting the values. If the filter is impossible to design due to constraints of the specified values, an alert will appear with a message coaching the user into selecting different parameters. In fact, instruNet will not allow you to exit this dialog until the parameters are acceptable, or the filter has been turned off by selecting Off in the Filter popup.
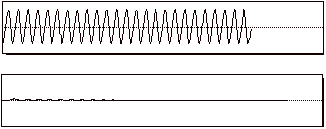
The Filter Order ranges from 1 to 32, depending on the supplied parameters, with version ≥ v3.3 instruNet software (and 1 to 16 with older software). As the filter becomes more demanding, the filter order increases, and the time to run the filter also increases. In a typical case, it takes 0.1 μSeconds per order per point to run the filter. • View the results of your filter by observing the effect it has on the waveform in the Snapshot display. If you have a function generator connected, watch what happens when you slowly change its frequency from 10Hz to 500Hz, for example. Figure 2.21 shows a 35 Hz signal applied to Ch1 Vin+, before and after the implementation of a 30 Hz lowpass filter.
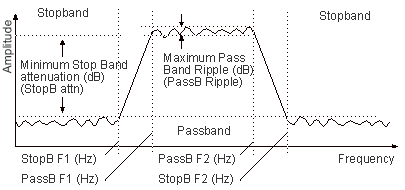
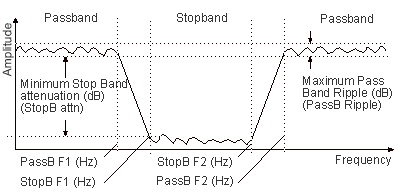
Figures 2.19 through 2.21 show the filter models for the Highpass, Bandpass and Bandstop filters.
Table 2.1 shows which fields in the Settings area must be set for each filter model.
Table 2.1 Fields required for each Filter model • Play with the different filter models and settings while viewing their effects in the snapshot display. For example, to turn on a highpass filter, select Highpass Filter in the Settings popup, select Elliptic in the Filter popup, and then set the Passband F1 Hz, Stopband F1 Hz, Stopband Attn, and Passband Ripple fields as desired using Figure 2.19 as a guide. Remember to press the Enter or Update button to create the filter. Working with Voltage Output Channels
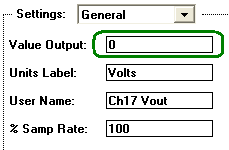
• In the Network page, click on the 1st cell of the first voltage output channel, if one is available. For the i430, this would be the "Ch17 Vout" channel. When the Channel Setup dialog opens, set the Value Output field to 1.0, and press the Enter button. The analog output channel is immediately updated to the new value when Enter is clicked. • Click OK to return to the Network page and view the Value Input column for the chosen Voltage output channel. It should display a value in the vicinity of 1V. With Voltage outputs, instruNet reads back the output voltage and displays this value in the Value Out column. This is useful information when loading of the output signal will change its value. An example of this is a bridge excitation circuit where it is important to know the value of the excitation voltage within a small margin (e.g. to ±.01%) yet the actual voltage only needs to be within several percent of the target voltage. Working with Digital I/O Channels Many hardware products provide bidirectional bit channels (e.g. Ch25 Uio1 on i430, Ch25 Dio1 on i100). When used as an input, approximately 2V to 12V applied to the signal is measured as logic 1, and approximately 0V to 0.8V is measured as logic 0. When used as an output, logic 0 pulls the signal low to approximately 0.8V, and logic 1 pulls the signal high (3.3V to 5V). Each i/o bit is set up as either an input or output, and to view/adjust this setting, select a Dio Bit channel in the Channel Options submenu within the Hardware menu, select Bit Options in the Settings submenu within the Channel Options dialog, and then set the Direction field to Input or Output.
Different Types of I/O Signals
Modes of Operations
Digital I/O -- Group Channels
Working with the i2x0/i60x Controller, Time Since Reset Channel The instruNet i2x0/i60x Controllers offer a channel that provides the time since the Controller was last reset. A reset occurs when instruNet is first used after power up, the computer resets, and when the Reset button is pressed in the Network page. This channel is called "Ch12 Time" and returns a number in units of seconds. The i200/i230 controllers base this time on an internal 62bit counter that counts 4MHz. The i240/i60x bases this time on the Windows OS QueryPerformanceCounter() counter. • Select the Network page by clicking the Network tab, and scroll down until you see the Controller's Ch12 Time channel. Notice how the Value cell slowly increments at a 1 second rate. Working with Multiple Controllers One can attach up to eight i240/i60x controllers to a computer to increase total system throughput. For example, four i240 controllers (where each is attached to a separate i4xx Card Cage or i100 box) can digitize 16 total channels at 41Ks/sec/channel; or 32 channels at 20.5K each. In this example, each controller runs at 166Ks/sec/controller and the entire system runs at 664Ks/sec/system. For more details on working with multiple controllers, click here. This concludes the tutorial. From here you might consider exploring How to connect a specific sensor to specific software. |
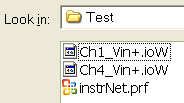 Click the Open button to load in the previously saved waves from disk. A File open dialog will appear, and it is here that you must select one of your previously saved files (e.g. "instruNet.prf", "Ch1 Vin+" or "Ch3 Vin+"). After your waves are loaded in, they should appear in their displays.
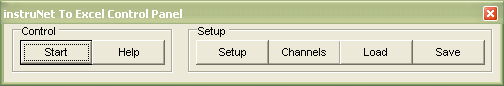
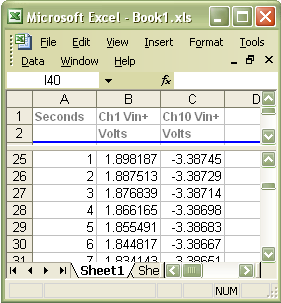 Press the Start button and watch a new spreadsheet window appear and fill with instruNet data, as shown to the right. When finished, you can save or delete the Excel spreadsheet file.
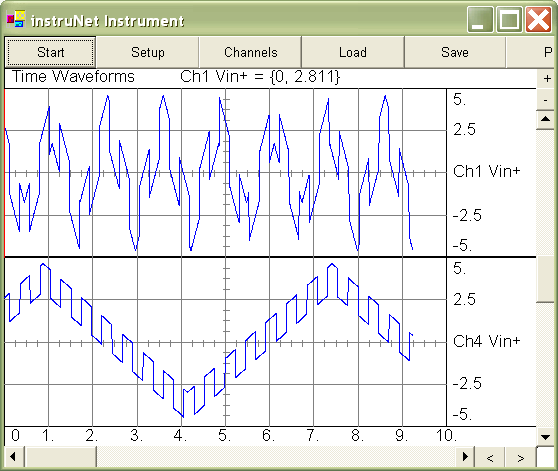
 • Click the Start button to begin digitizing, and then click Stop after a few moments.
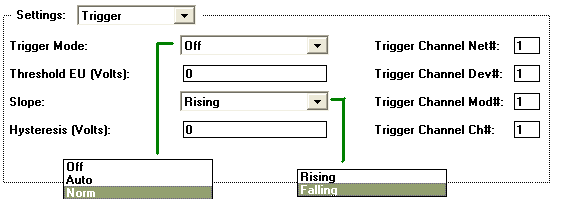
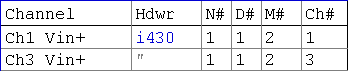 • Enter the address of a channel to trigger from into the
Trig Net#, Trig Dev#, Trig Mod# and Trig Chan# fields. If you are not sure of a channel's
address, go back to the Network Page and look at the Channel and Address column for the channel
you want to trigger from. The address for the two channels shown in the above figure would
be {1, 1, 2, 1} and {1, 1, 2, 3}. For example, if you wanted to trigger from channel Ch1 Vin+, you
would enter the following values: 1 into Trig Net #, 1 into Trig Dev#, 2 into Trig Mod#, and 1
into Trig Chan#.
• Enter the address of a channel to trigger from into the
Trig Net#, Trig Dev#, Trig Mod# and Trig Chan# fields. If you are not sure of a channel's
address, go back to the Network Page and look at the Channel and Address column for the channel
you want to trigger from. The address for the two channels shown in the above figure would
be {1, 1, 2, 1} and {1, 1, 2, 3}. For example, if you wanted to trigger from channel Ch1 Vin+, you
would enter the following values: 1 into Trig Net #, 1 into Trig Dev#, 2 into Trig Mod#, and 1
into Trig Chan#. 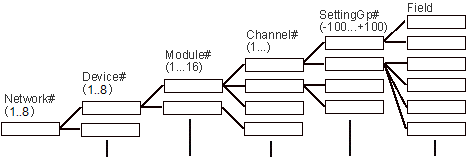
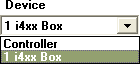 The Device popup menu lists the network Devices that are attached to the Controller specified
in the Network popup menu. When you select a Controller in the Network popup, all devices
attached to it appear in the Device popup. In the figure shown to the right, only one network
device is attached to the Controller and it appears as the second item in the popup.
It is an
The Device popup menu lists the network Devices that are attached to the Controller specified
in the Network popup menu. When you select a Controller in the Network popup, all devices
attached to it appear in the Device popup. In the figure shown to the right, only one network
device is attached to the Controller and it appears as the second item in the popup.
It is an 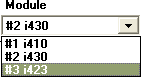 The Module popup lists all Modules in the currently selected {Network, Device}.
Each card in the i4xx Card Cage is considered to be one Module; whereas the i100 box is considered to its own 1 Module.
The Module popup lists all Modules in the currently selected {Network, Device}.
Each card in the i4xx Card Cage is considered to be one Module; whereas the i100 box is considered to its own 1 Module. The Channel popup lists all analog and digital I/O channels in the currently selected
{Network, Device, Module}. The illustration to the right shows 3 channels, 2 of
which are voltage inputs, and the 3rd which is a voltage output.
The Channel popup lists all analog and digital I/O channels in the currently selected
{Network, Device, Module}. The illustration to the right shows 3 channels, 2 of
which are voltage inputs, and the 3rd which is a voltage output.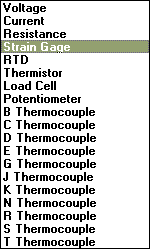 Any voltage input channel can attach to any of the following sensors: Voltage source, Current source, Resistance source, Strain Gage, Load Cell, Accelerometer, Potentiometer, RTD, or types J, K, T, E, R, S, B, and N Thermocouples. Sensors can be wired in a variety of configurations including: Differential Voltage Measurement (requires 2 voltage input channels, e.g. Ch1 Vin+ and Chi Vin-), Single-ended Voltage Measurement, Shunt Resistor, Voltage Divider, Full Bridge, ½ Bridge, and ¼ Bridge.
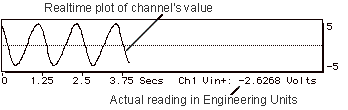
 • Click on the
 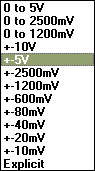 • Click on the
  • Several hardware products provide optional analog low pass
filters on every analog input channel. If filters are available, you will see a
• Several hardware products provide optional analog low pass
filters on every analog input channel. If filters are available, you will see a 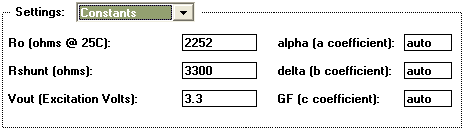
 instruNet supports Calibration and Converting to different scales with a two point
mapping scheme (e.g. show PSI at sensor instead of Volts at screw terminals).
All channels have a Mapping settings area, shown to the right,
that defines the relationship
between "internal units" and "external units".
If you do not see the Calibrate button in your software, make sure you are using instruNet
software version ≥ 3.5.0.1 (file "iNet32.dll"). To check your version, select ABOUT in the instruNet World HELP menu; and to update for free, click
instruNet supports Calibration and Converting to different scales with a two point
mapping scheme (e.g. show PSI at sensor instead of Volts at screw terminals).
All channels have a Mapping settings area, shown to the right,
that defines the relationship
between "internal units" and "external units".
If you do not see the Calibrate button in your software, make sure you are using instruNet
software version ≥ 3.5.0.1 (file "iNet32.dll"). To check your version, select ABOUT in the instruNet World HELP menu; and to update for free, click 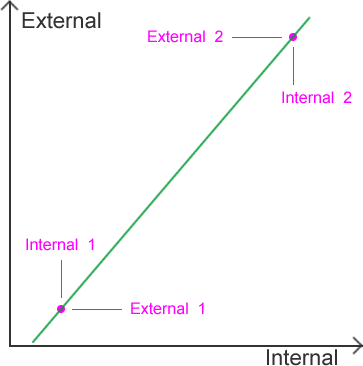 External units are what the user
sees in the Record page, the Network page, and the numbers returned by the iNet() subroutine.
External units are linearly mapped to Internal units, and are therefore defined by a line
in a 2-dimensional coordinate axis plane. This line can be described by four numbers that
define 2 points (i.e. {x1, y1}, {x2, y2}) or by two numbers that specify a scale and
offset (i.e. y = [scale * x] + offset).
In the Mapping area, we refer to "x" as "Internal" and "y" as "External".
Initially all channels are set up with a
one-to-one mapping such that External units are identical to Internal units (i.e. Scale = 1, Offset = 0).
External units are what the user
sees in the Record page, the Network page, and the numbers returned by the iNet() subroutine.
External units are linearly mapped to Internal units, and are therefore defined by a line
in a 2-dimensional coordinate axis plane. This line can be described by four numbers that
define 2 points (i.e. {x1, y1}, {x2, y2}) or by two numbers that specify a scale and
offset (i.e. y = [scale * x] + offset).
In the Mapping area, we refer to "x" as "Internal" and "y" as "External".
Initially all channels are set up with a
one-to-one mapping such that External units are identical to Internal units (i.e. Scale = 1, Offset = 0).
 The
8-Pole
The
8-Pole 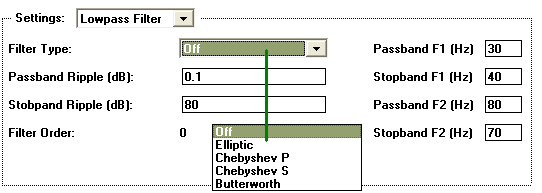
 Some hardware devices, such as the