Hidden
Hidden
Hidden
Hidden
Hidden
Hidden
Hidden
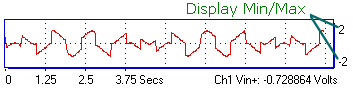
INSTRUNET WORLD STRIP CHART "RECORD" WINDOW The Record Page is used to view record digitized waveforms in real-time, store these waves to disk, load them from disk, and scroll through them post acquisition. The Record page, illustrated below, is chosen by pressing the Record tab at the base of the instruNet World window.
Setting Up Channels
Setting Up Displays
The vertical axis is set up in the Display dialog. To access this dialog from the Network page, click on the channel of interest and then select Display in the Settings popup menu.
The display vertical axis is in External Engineering units, as described here.
Digitize directly into RAM memory or a File on Disk? Oscilloscope or Strip Chart Scan Mode
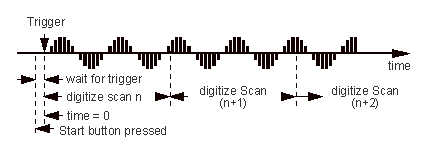
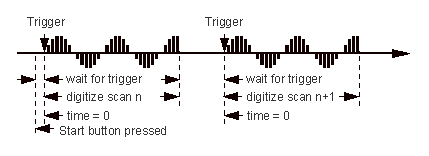
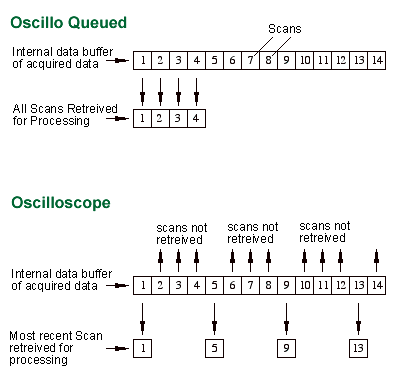
Oscilloscope mode has two variations, Oscilloscope and Oscillo Queued. Both Oscilloscope and Oscillo Queued acquire and store scans of data in a buffer for processing. In Oscilloscope mode the most recent scan of data in the buffer will always be returned for processing (first in, last out). In Oscillo Queued mode the scans are retrieved from the buffer in sequence (first in, first out). A typical example of how a data acquisition program using Oscilloscope mode would work is as follows: first the program would wait for the user specified trigger condition and then acquire the first scan of data; next the program would process the acquired scan (i.e. display, analyze, save to disk) while instruNet continued to acquire scans in the background based on the trigger condition, while the processing is going on; next the program would retrieve the most recent scan from the queue, ignoring older scans. In the Oscilloscope case the scan returned from the buffer will always be the most recently acquired scan, and all other scans in the buffer will be ignored. For example if each scan were 10ms long, the trigger condition was set to none, and the processing took 40ms, then the program would retrieve the first scan, process it and then retrieve the 4th of the 4 queued scans (i.e. the most recent scan) that had accumulated in the buffer while it was processing the first scan. The 3 other older scans would be discarded. If the example above were done in Oscillo Queued it would work as follows: first the program would wait for the user specified trigger condition and then acquire the first scan of data; next the program would process the acquired scan (i.e. display, analyze, save to disk) while instruNet continued to acquire scans in the background based on the trigger condition; next the program would retrieve the next scan in the queue (i.e. the acquired scan that immediately followed the first acquired and processed scan). In Oscillo Queued mode triggered scans continue to accumulate in the queue and are returned in order. In Oscillo Queued mode all scans are returned by instruNet for processing but if a lot of processing is required between scans the instruNet buffer can eventually overflow at which point instruNet will return an error message. In Oscilloscope mode the most recent scan is always returned and others are discarded. While scans are discarded in Oscilloscope mode the buffer will not overflow. If the time to process data takes less than the time of a scan then both modes will behave identically. The below illustrations show the difference between Oscilloscope and Oscillo Queued modes.
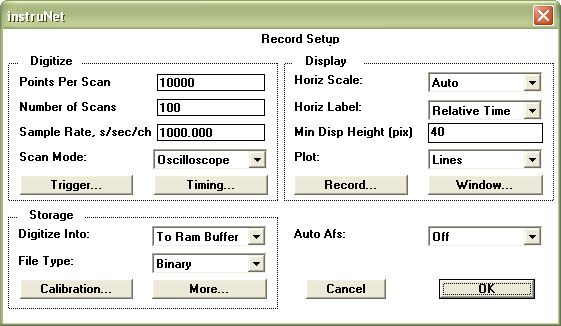
Record Setup Dialog
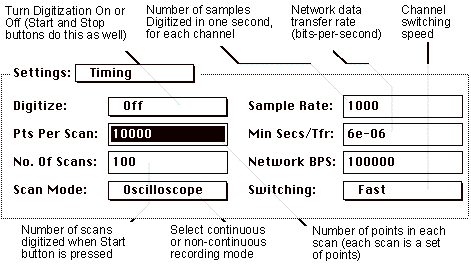
Timing Options
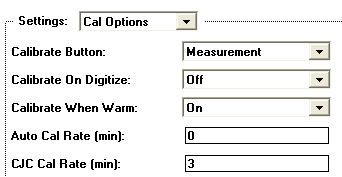
The Points per Scan, and the Number of Scans Fields specify the number of points (4bytes per point) that are digitized for each Scan, and the number of scans that are digitized when the Start button is pressed. For example, if you digitize 100 pts/second, with 1000 points per Scan (i.e. 10sec per scan), and 10 scans, then your entire acquisition would consume 100seconds. Pressing the Stop button will halt the digitization process, independent of where it is in its cycle. The Scan Mode field was discussed in detail in the previous Oscilloscope or Strip Chart Scan Mode discussion. The Record Setup dialog master Sample Rate field specifies the number of points digitized per second per channel. All channels run at this rate unless their % Sample Rate Field in their General settings area has been modified from its default value of 100%. This field enables one to run specific channels at a sample rate less than the master sample rate in the Timing dialog. For example, if the master sample rate is 1000s/sec and a channel's % Sample Rate is set to 25, then the channel will run at 250s/sec. The Network BPS specifies the network data transfer rate, in units of bits-per-second. On power up, the network is set to the fastest possible rate. If the instruNet system reduces your sample rate to an unacceptable level, or your analog voltage data is too noisy, please see SAMPLE RATE VS. INTEGRATION VS. NOISE. Calibrate Options
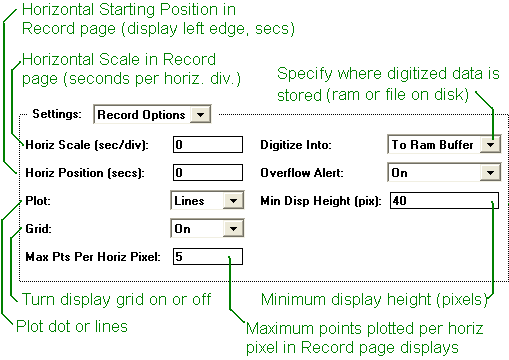
Display Options
It is in the Options dialog that one specifies to Plot Dots or Lines, to turn the Grid On or Off, to set the horizontal scale (i.e. time per horizontal division), and to set the maximum plotting density (maximum points plotted per horizontal pixel). Plotting Lines (i.e. connecting points with lines) takes more time than Dots, yet is easier to read if the points are far apart. The Grid take some time to plot as well, and might not be desirable if you are trying to maximize your update rate in Oscilloscope mode. If the horizontal scale (Horiz Scale) is too small (e.g. 10ms/div), the waveform might whip across the screen and be difficult to see in the Strip Chart mode. The maximum points per horizontal pixel parameter is useful at plotting only a fraction of the digitized points in cases where you are digitizing ten's of thousands of points and don't want the computer to slow down due to plotting. The Horizontal Position field is very similar to the Horizontal scroll bar in that it defines the time of the left edge of all displays. If Overflow Alert is set to On, an Alert box is shown when a digitize buffer overflows (i.e. it fills faster than it is read); otherwise digitizing proceeds without an Alert. Saving Data
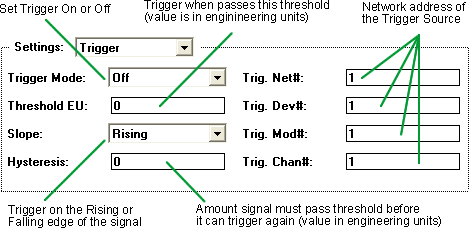
Trigger Options
The Trigger Mode field is used to specify no trigger (Off), Automatic trigger, or Normal trigger. Normal trigger will wait forever until the trigger condition is met, whereas Automatic will trigger after several seconds even if the trigger condition is not met. The Threshold EU field is used to set the threshold level, in engineering units, that the incoming signal must pass in order to trigger. The Slope field sets the trigger condition for either a low-to-high pass through the threshold (Rising), or a high-to-low (Falling). The Network number, Device number, Module number, and Channel number fields are used to specify the network address of the input channel that is to be used as the trigger source. For example, {1,1,1,1} would specify the first channel within the first module in the first device tied to the first network. Getting Ready to Digitize Digitizing If Your Sample Rate is Too Fast...
Record Buttons
|
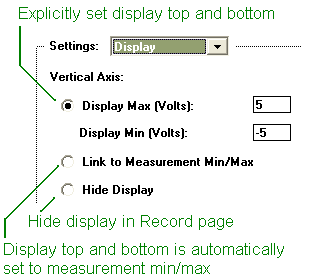 The Display dialog, illustrated to the right, provides 3 different ways to control displays: